Analytics: The Reports
- 19 Nov 2021
- 2 Minutes to read
- Contributors

- Print
- DarkLight
- PDF
Analytics: The Reports
- Updated on 19 Nov 2021
- 2 Minutes to read
- Contributors
- Print
- DarkLight
- PDF
Article Summary
Share feedback
Thanks for sharing your feedback!
This page will give an overview of the charts/tables in the Dashboard tab. If you would like reporting other than what's listed, please fill out our feature request form and help us prioritize new features. We'll also keep you updated as we roll out improvements.
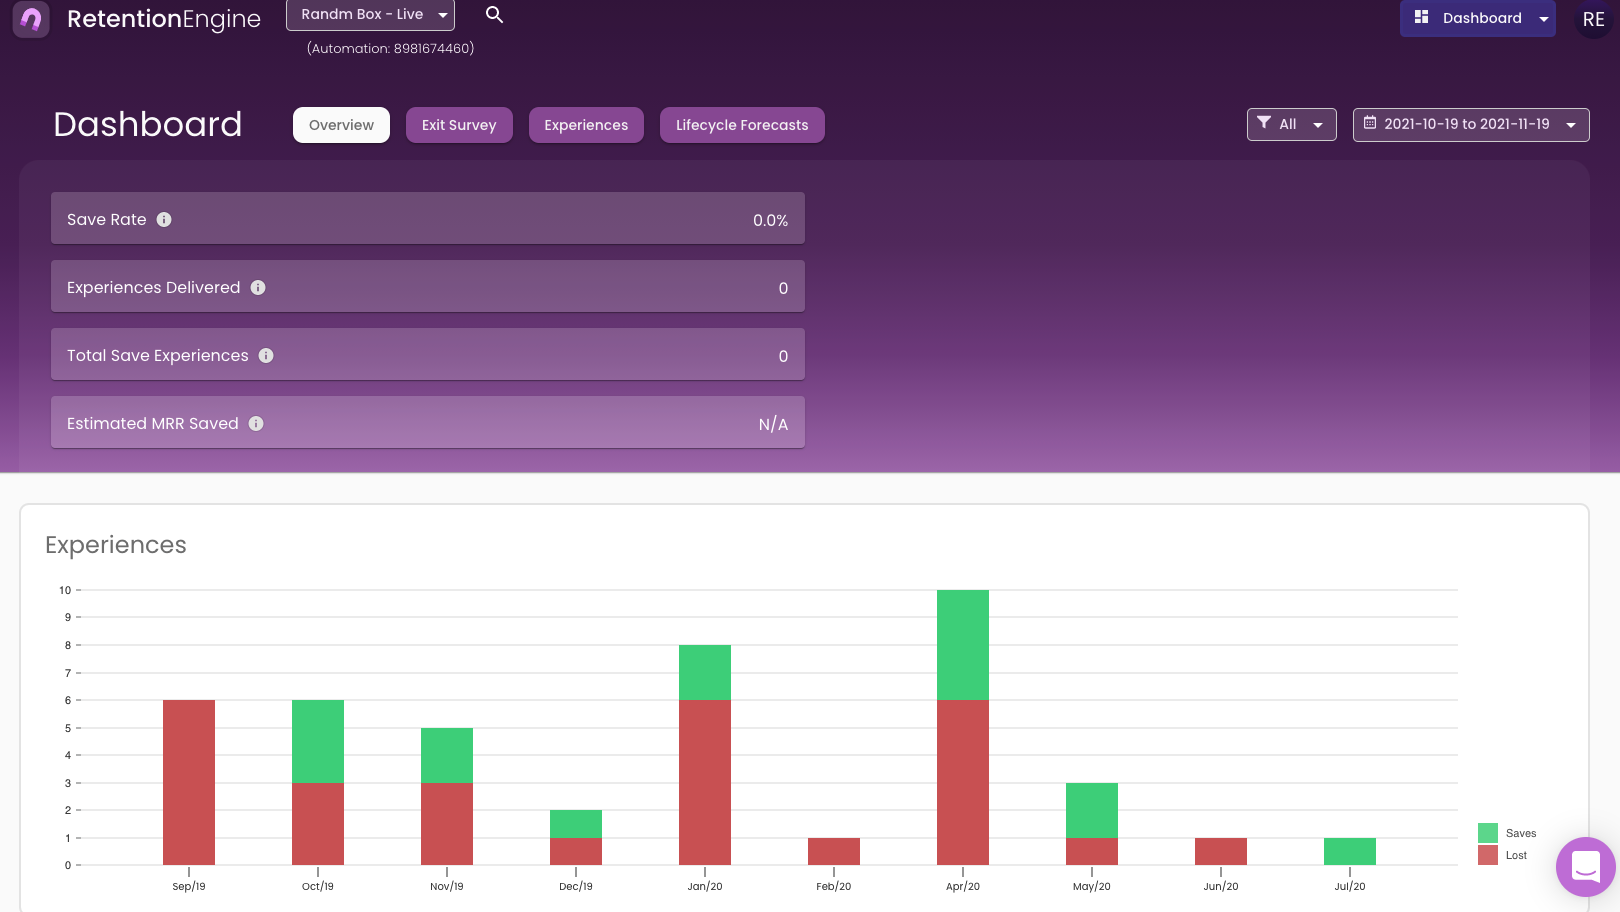
Performance Metrics
- Experience: An experience refers to any time a customer selects the cancel button on your website.
- Save: A save is any outcome that did not result in a cancel. This includes a save by any of the cancel resolutions, a pause, or an abandon.
- Save Rate: The save rate is the number saved divided by the number of experiences.
- Estimated MRR Saved: The estimated MRR saved is calculated based on the subscription price and the billing interval, representing the average monthly income that the subscription produces.
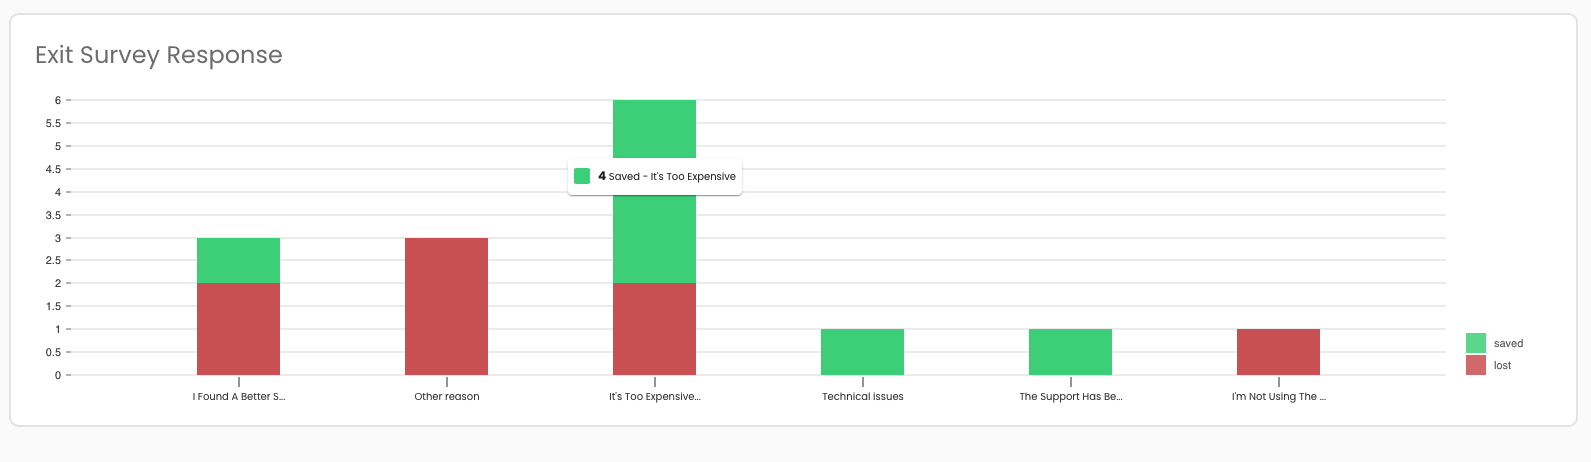
Exit Survey Responses
This chart shows all of the number of responses to the exit surveys. The red represents the ones that canceled, and the green represents the saves. You can hover over a response and it will give you the exact number of users that selected this choice, the number that canceled, the number that were saved, and the save rate.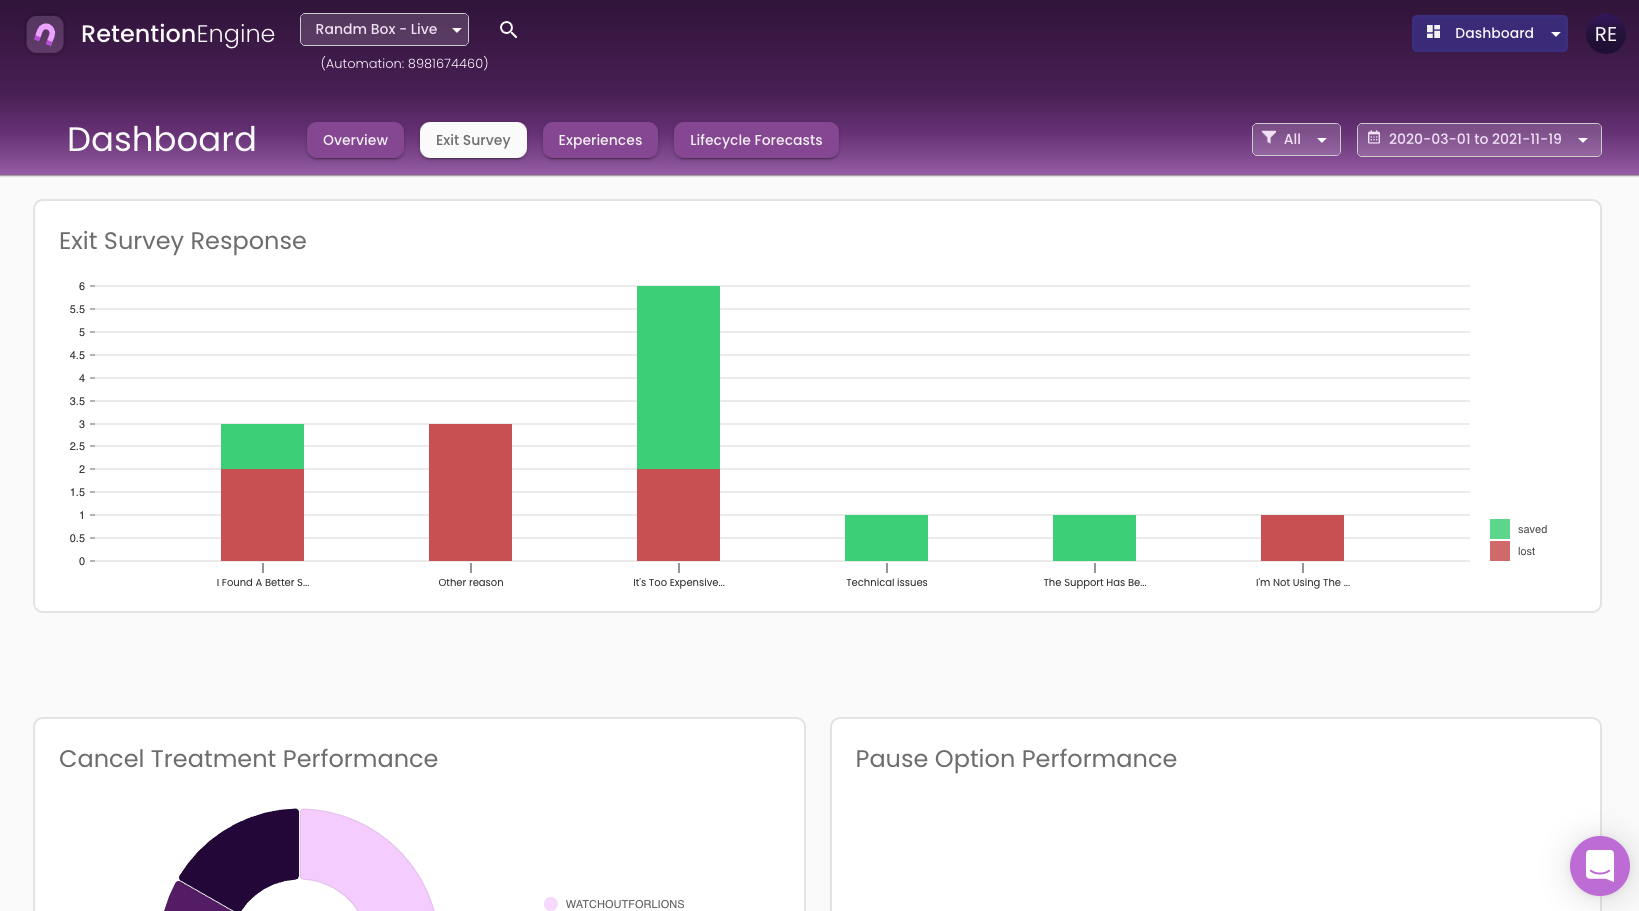
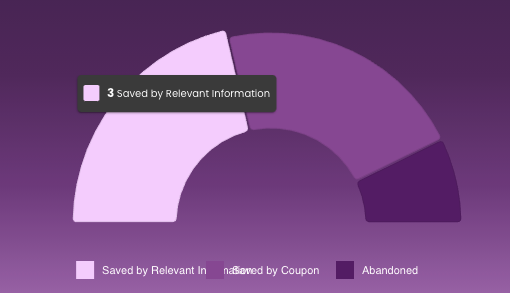
Saved Experience Outcomes
This chart shows the outcomes of saved experiences. The possible outcomes are Saved by Discount, Saved by Gift, Saved by Relevant Information, Saved by Contact Support, Saved by Pause, Abandon, and Canceled.
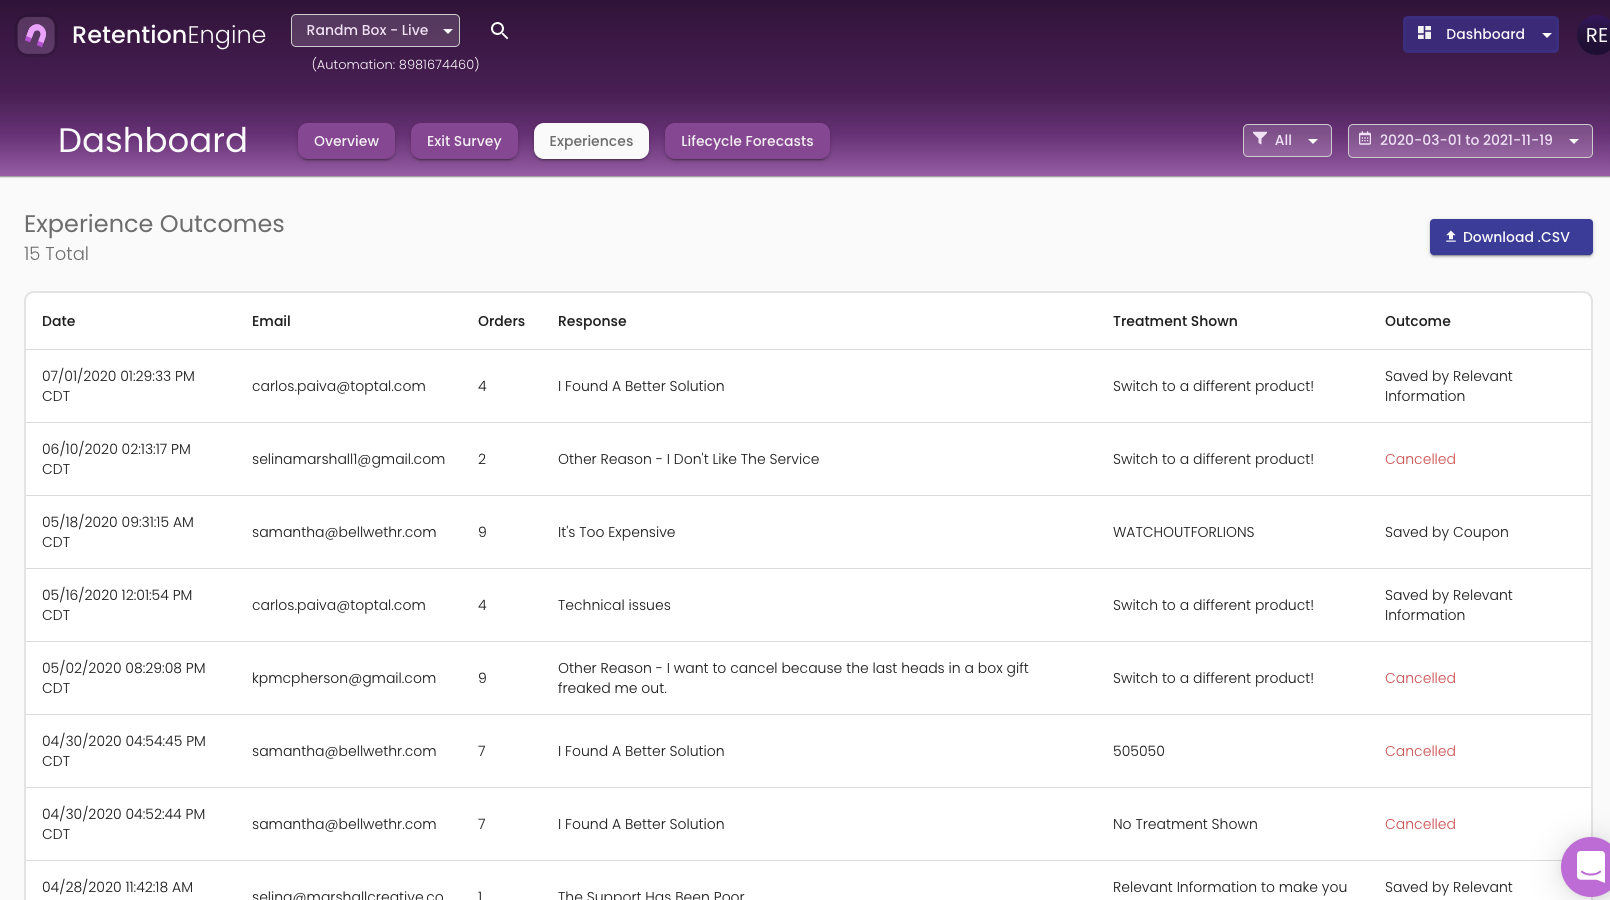
Experiences
This is the list of customers who have engaged with RetentionEngine. You can export the full list in CSV format.
Coming soon - We will report the daily saves and save rate over the date range.
Top Cancel Resolutions and Pauses
These tables are key to understanding how each resolution- and pause options- are performing.
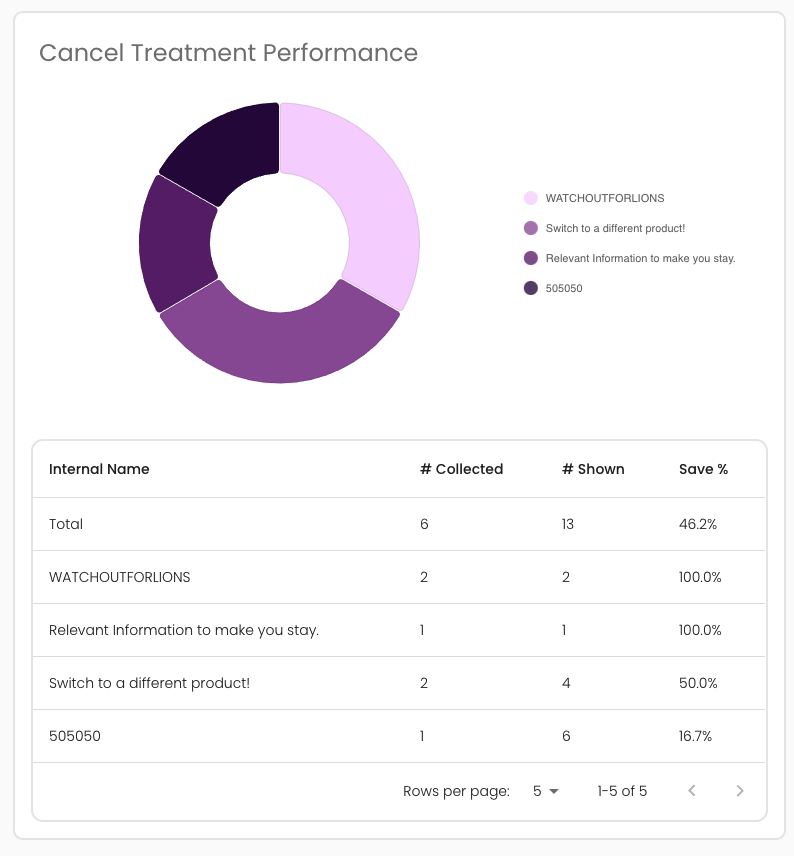
- Shown is the number of times a resolution was shown to a customer.
- Selected is the number of times the resolution saved a customer, specifically -
- For a discount or gift, selected means the customer claimed the discount or gift by clicking on the button.
- For contact support or relevant information, selected means the customer clicked one of the links or abandoned the experience on this screen.
- Win % is the number selected divided by the number shown.
If some of your cancel resolutions are not performing well, you can inactivate them and experiment with others. Furthermore, if you are not happy with the rate at which resolutions are being shown. We can speed up/slow down the learning rate. Reach out to support@bellwethr.com with the subject line, "Learning Rate", and we'll work together to adjust this to your needs.
Experience Results
This table shows each experience. The information included is the date, Customer ID, Exit Survey Response, Original Plan, and Outcome. You can click on the outcome and see even more information about the experience, including the Subscription ID, Resolutions shown, and Customer Email.
.png)
You can also download this table into a CSV file.
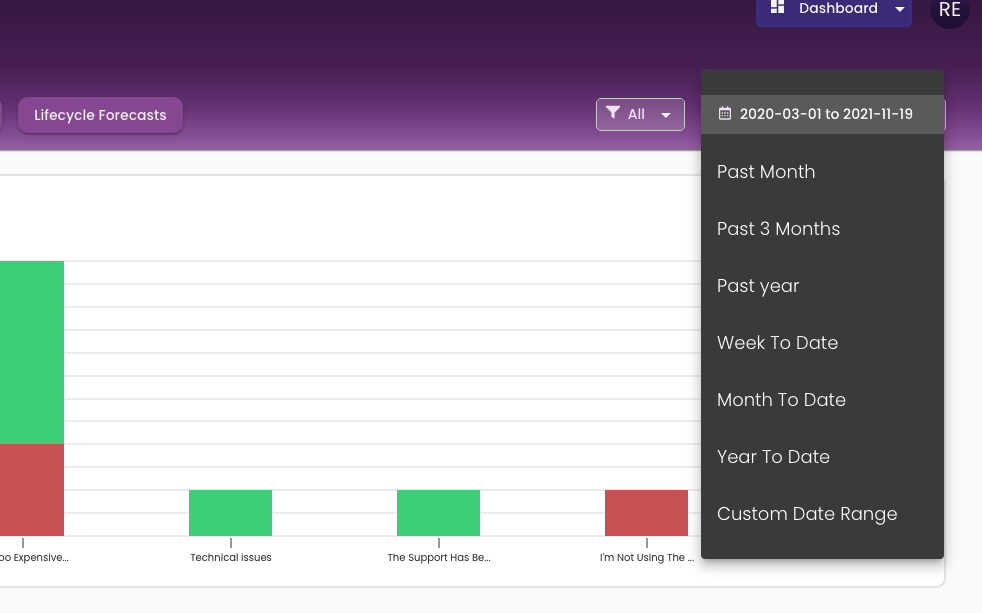
Filtering
You can filter the analytics page by date and by exit survey response. The filtering applies to every aspect of the Analytics page. The default for the analytics page shows you the previous 30 days.
Was this article helpful?